VISUALISING SOUND
Sonagrams
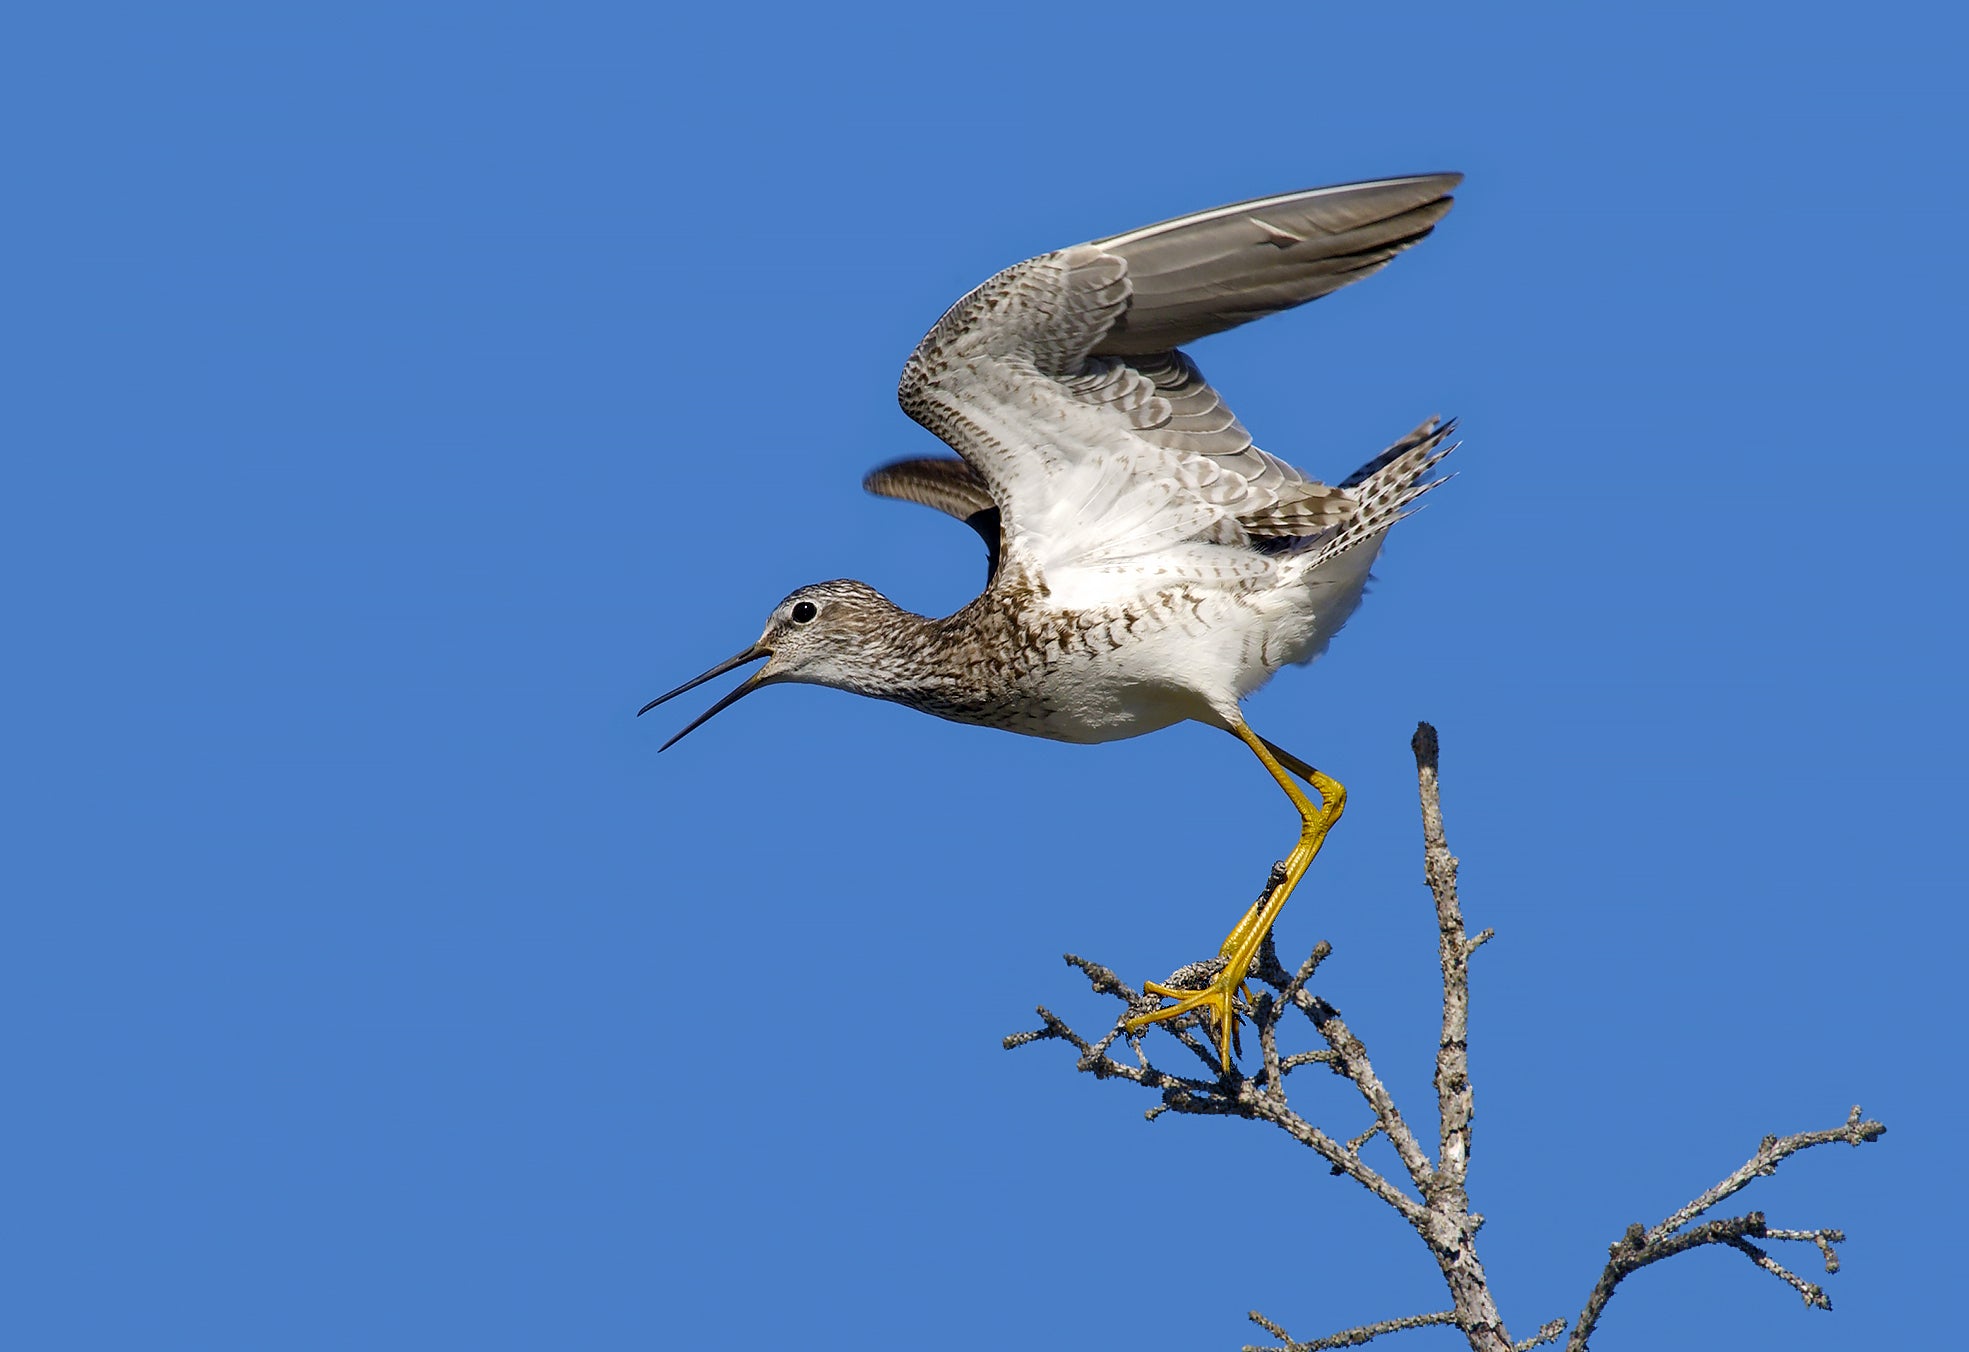
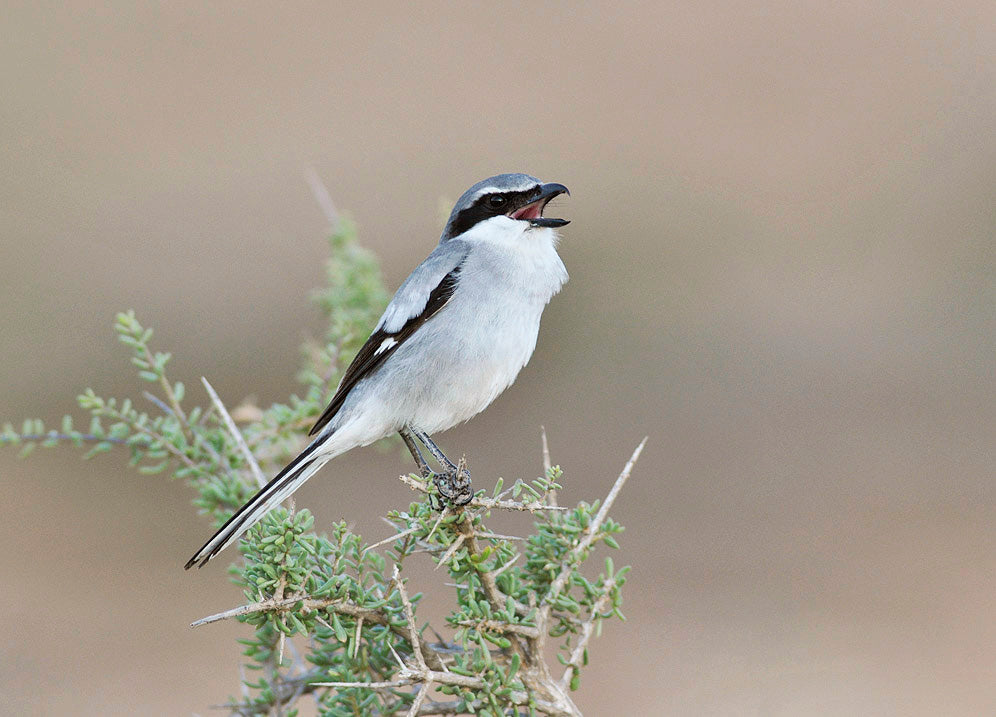
Bird identification has typically revolved around plumage colours, structural features and behaviour. Field guides and birding journals tend to concentrate more on visible features than on vocalisations
The following section introduces sonagrams (the ‘structure’ of bird sounds) and how to read them, bringing a visual and comparable standard for defining bird sounds.
Reading sonagrams
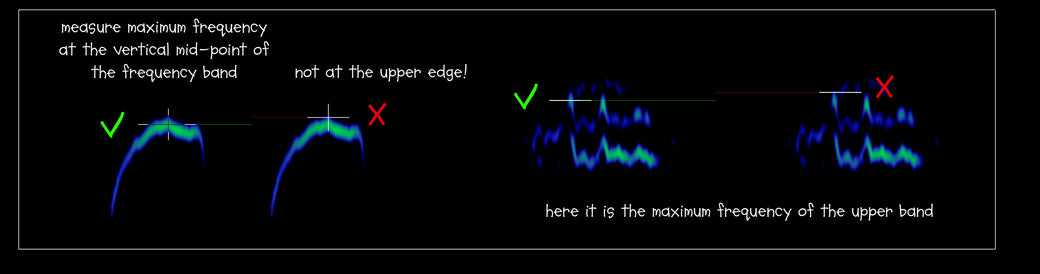
Terms & definitions
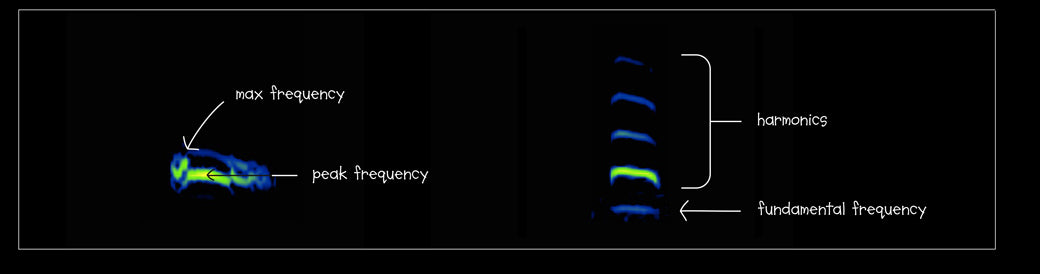
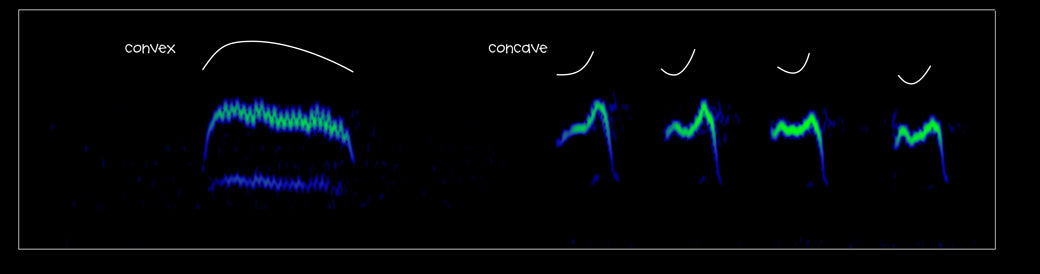
Describing shapes in sonagrams
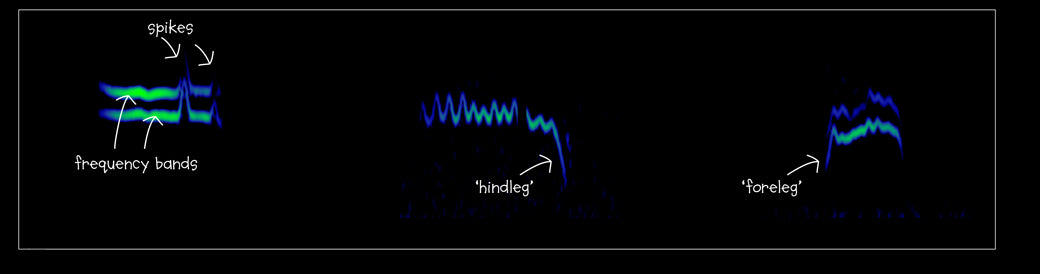
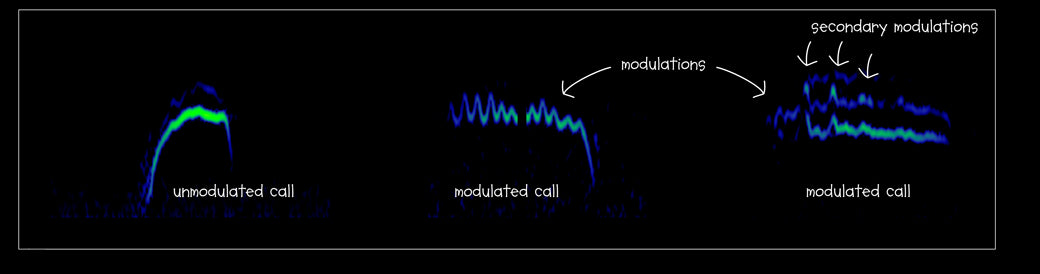
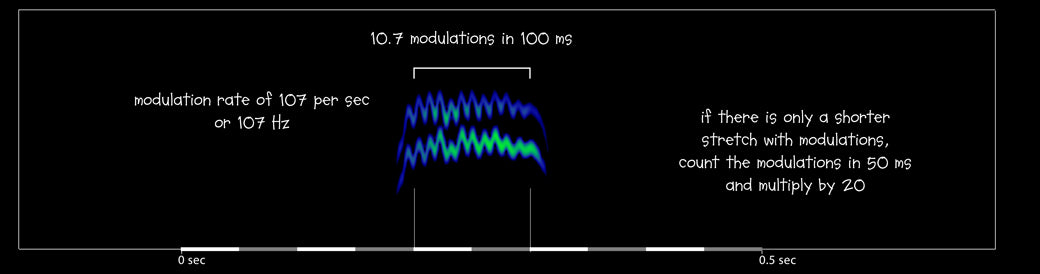
Modulations
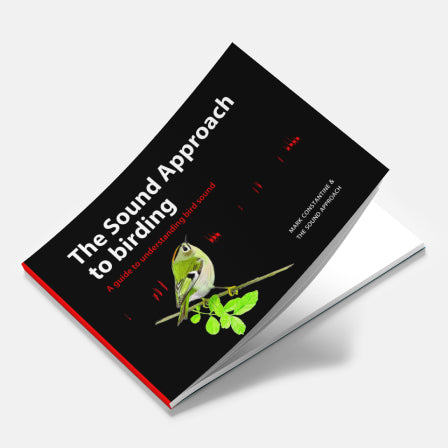
The Sound Approach to Birding
The book that started it all, By Mark Constantine and The Sound Approach. No matter what your level of knowledge, with “The Sound Approach to Birding”, you will enhance your field skills and improve your standards of identification whilst listening to over 200 high quality sound recordings.